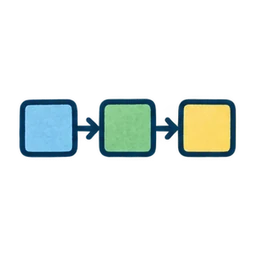
A diagram that links a program’s resources, activities, direct outputs and changes for participants, setting out the assumptions about how outcomes will occur and what needs to be checked. Completing the diagram does not, by itself, demonstrate a causal effect.
A method for making explicit the desired change and the pathways and assumptions leading to it. It sets out, as testable hypotheses, why implementing activities is expected to produce outcomes.
Participants and roles needed
Program officers, frontline staff, managers and participant representatives, among others. Determine numbers based on ease of discussion and the perspectives needed.
Program designers, evaluation officers, key stakeholders and beneficiary representatives. An illustrative plan includes 1–2 facilitators plus 6–15 participants. Large programs use multiple workshops.
Deliverables
Logic model diagram (one page)
List of assumptions and external factors
List of candidate indicators
Outcome pathway diagram
ToC narrative with a list of assumptions and supporting reasons
List of intermediate outcome indicators
What to check before use
If the main purpose is to estimate a program’s causal effect numerically, a separate evaluation design is needed to examine effects.
Treating the model as the sole agreed causal pathway when stakeholders hold different views.
If only activity schedules are being organized without considering why change occurs, prepare an implementation plan first.
Treating a pathway as unchangeable once agreed. Complex programs require updates as circumstances change.
Exploring deeper hypotheses about change when a logic model stops at activities and outputs
Strengths
Accessible without specialist knowledge and provides a common language for stakeholders
Directly supports the development of evaluation indicators and questions
Explains the whole program on one page and communicates well to funders
Identifies weak assumptions and gaps in program reasoning early
Improves evaluation questions by making causal hypotheses about why change occurs explicit
Makes program assumptions and limitations visible early and can reduce the risk of failure
Supports shared understanding in partnerships across agencies and sectors
Directly supports setting milestones for midterm evaluation by describing long-term change pathways
Limitations
A simple one-way diagram may miss branching or cyclical change. Add the necessary relationships while maintaining readability.
Can become a document that is completed and then forgotten; without updates, it loses practical value
The model’s logic is not guaranteed to work in reality; it remains a hypothesis
Unless the detail of the diagram and its supporting rationale fits the purpose, preparation becomes burdensome. Small programs can begin with their main pathways and assumptions.
Too many assumptions can produce a complex diagram that is impractical to use
Risks oversimplifying complex social change and allowing the model to steer reality
To find other candidates, use the Method library; to choose again from your evaluation question, use Method finder.
Use the comparison to decide whether a method fits
Methods with the same difficulty rating may require different expertise. Look beyond the ratings: consult the sources to check whether the method addresses your question and whether its assumptions are met.
EvalCompass Editorial Team. “Compare methods”. EvalCompass, updated 2026-10-09. https://evalcompass.jun-nakatani.com/en/compare
Add the date you accessed the page. Text created by this site is available under CC BY 4.0. Quotations, external materials, and bundled fonts have their own terms of use. When reusing content, credit the source, link to the license, and indicate any changes.