Logic Model
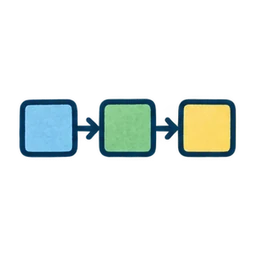
A diagram that links a program’s resources, activities, direct outputs and changes for participants, setting out the assumptions about how outcomes will occur and what needs to be checked. Completing the diagram does not, by itself, demonstrate a causal effect. [1]
- Difficulty
- Introductory
- Cost
- Low
- Duration
- Illustrative estimate (adjust for scale and staffing): several hours to 2 days (a stakeholder workshop is recommended)
How it works at a glance
A logic model connects activities with short- and long-term outcomes and their assumptions. [1]
In practice, it maps the outcomes a program needs to examine to indicators and provides material for revisiting assumptions with stakeholders. [1]





When to use it and when it is unsuitable
When to use it
- Clarifying the links between activities and outcomes with stakeholders when planning a new program
- Deciding what to measure at each stage when preparing an evaluation plan
- Explaining program intentions on a single page in a grant application or program report
- Identifying which break in the chain explains a lack of effects when reviewing an existing program
When it is unsuitable
- If the main purpose is to estimate a program’s causal effect numerically, a separate evaluation design is needed to examine effects.
- Treating the model as the sole agreed causal pathway when stakeholders hold different views.
Participants, roles, and deliverables
Participants and roles
Program officers, frontline staff, managers and participant representatives, among others. Determine numbers based on ease of discussion and the perspectives needed.
Main deliverables
- Logic model diagram (one page)
- List of assumptions and external factors
- List of candidate indicators
Implementation steps
- Confirm purpose and scopeDecide who the model is for and what it is for. Agree with stakeholders on its level of detail and whether it covers the whole program or a particular component.
- Work backward from the final outcomeStart with “Whose situation should this program ultimately change, and how?” Filling the model backward from the right (impact) to the left (inputs) helps maintain logical consistency.
- List each elementIdentify inputs, activities, outputs and immediate/intermediate/long-term outcomes using sticky notes or similar tools. Clearly distinguish outputs (direct products of activities) from outcomes (changes for participants).
- Check the causal chainRead each arrow aloud as an “if–then” statement and check for gaps in reasoning. Add intermediate outcomes where needed.
- Record assumptions and external factorsRecord in the margins the assumptions needed for the chain to hold and factors outside the program that influence it. These provide starting points for later evaluation questions.
- Assign indicators and update rulesAssign indicators to elements that need measuring and incorporate them into an evaluation design matrix. Set a review date that reflects program progress.
Strengths and limitations
Strengths
- Accessible without specialist knowledge and provides a common language for stakeholders
- Directly supports the development of evaluation indicators and questions
- Explains the whole program on one page and communicates well to funders
- Identifies weak assumptions and gaps in program reasoning early
Limitations
- A simple one-way diagram may miss branching or cyclical change. Add the necessary relationships while maintaining readability.
- Can become a document that is completed and then forgotten; without updates, it loses practical value
- The model’s logic is not guaranteed to work in reality; it remains a hypothesis
Common pitfalls
- Confusing outputs with outcomes: “10 training sessions delivered” is an output; changes in participants’ behavior are outcomes
- Expecting too many outcomes: long-term outcomes that are too ambitious for the program’s scale become impossible to evaluate
- Developing the model within the secretariat alone and omitting frontline and beneficiary perspectives
Conditions of use and evidence
- The diagram need not be linear. Branches and interactions can also be shown for complex programs. [1]
Connecting evaluation training to improvements in practice
The following program is fictional and provided for illustration. 12 NPO staff attend evaluation planning training, aiming to use their plans in their organizations 3 months later.
| Element | Completed example |
|---|---|
| Activities and outputs | 2 exercises; 12 participants prepare draft plans |
| Short-term outcome | Can explain the correspondence between questions, indicators and information sources |
| Intermediate outcome | Use draft plans in workplace meetings to determine what information to collect |
Common errors in judgment
Describing the 12 participants simply as an outcome
How to revise
Record participant numbers as an output separately from the actions participants can now perform
ReasonThis avoids confusing the number of people reached with the nature of their changes.
Drawing an arrow directly from training delivery to organization-wide improvement
How to revise
Insert draft plan preparation, workplace agreement and actual use as intermediate stages
ReasonThis makes it possible to examine conditions the program alone cannot control.
Organize your thinking by writing

Logic model worksheet
A practical template is available to fill in and print on A4 paper.
Open worksheetRelated practical guides
Related methods
References and checked sections
- Logic Model Development GuideW.K. Kellogg Foundation · 2004
- Section consulted
- Chapter 1, pp. 1–4; Chapter 3, pp. 27–34
- How it relates to the text
- Basic structure linking activities, outcomes and assumptions
Editorial and checking information

How to cite this page
Change history
- — Added source links, completed examples and examples of evaluation judgments.